Consumption
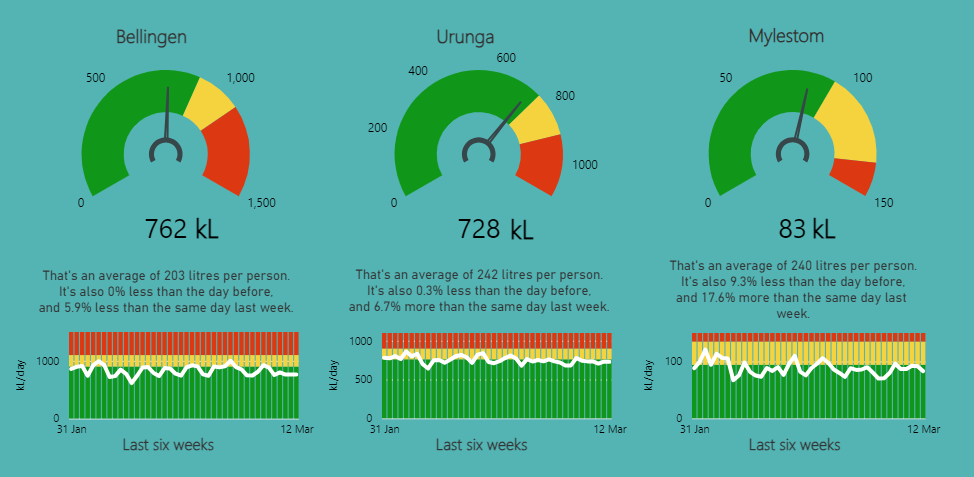
The Bellingen Water Portal provides consumption data across the Shire. Here you can review long-term trends and compare your own consumption to the average in your area. Check out the graph below to see consumption for a typical day in March across Bellingen, Urunga and Mylestom. Use your water bill to see how you compare.
